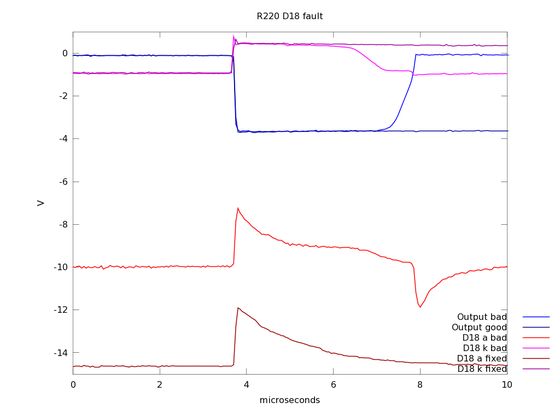
This shows the waveforms I measured on the R220. The pair of signals for each color show the signals before and after the bad diode was replaced. The blue curves show the output where the bad signal goes back to ground after 3 microseconds. The good curve shows it staying low for a bit time (9 milliseconds, longer than graph time scale). The other curves show the voltages on the leaky D18 before and after I replaced it. The magenta shows the D18 cathode where the leaky diode pulls the base down until it turns on setting the output back to ground. The red shades show the D18 anode which drops down as C2 discharges. The leakage raised the voltage some on this node and pulled Q2 base down.
Back to Previous page All of PDP-8 (Straight 8) Functional Restoration pictures